
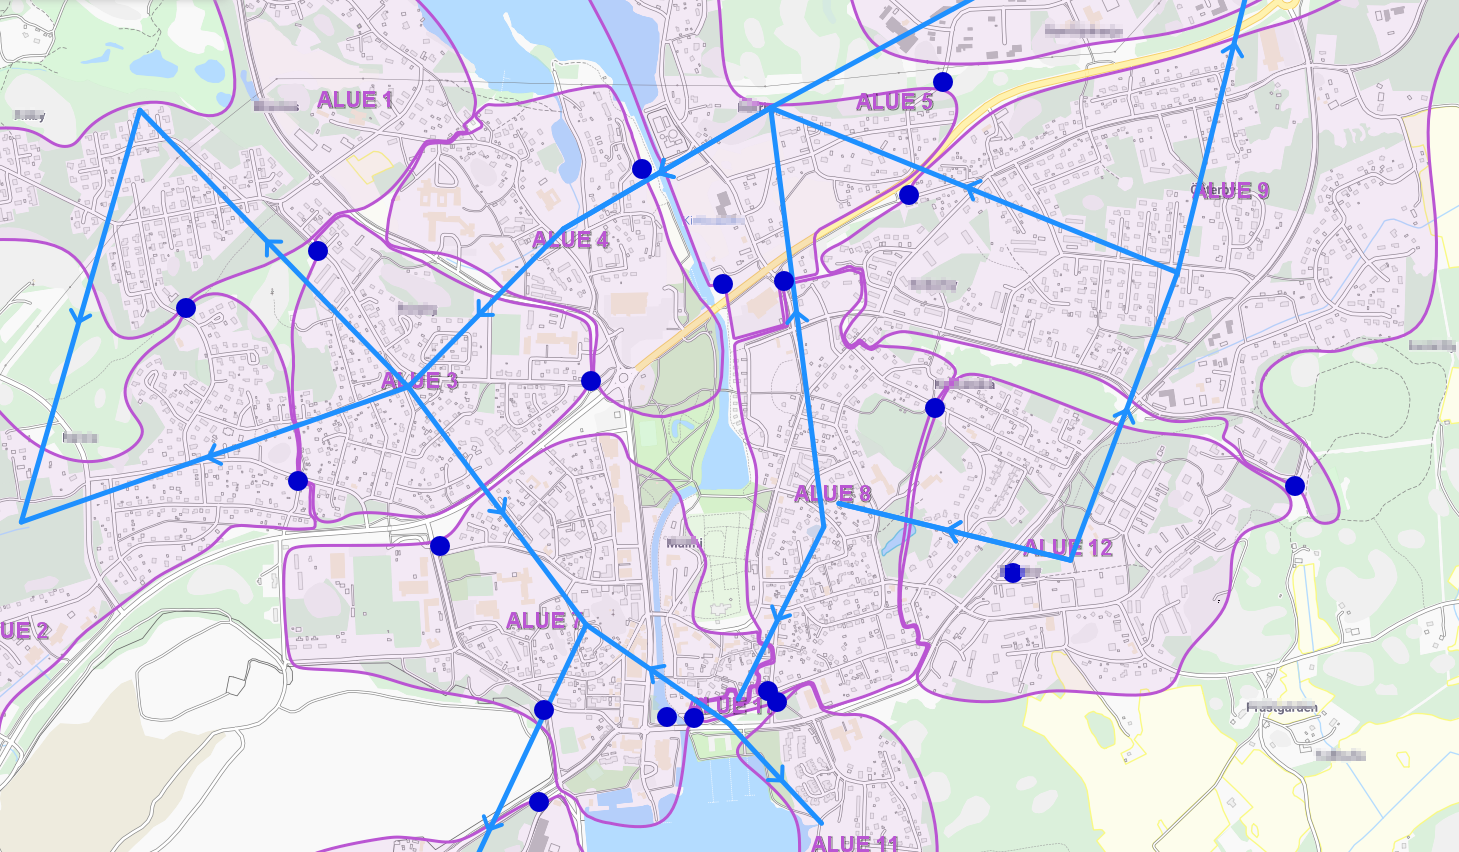
 Picture: Overview of measurement areas and directions of water flows between areas
Technology creates possibilities to understand what is really happening underground in the network and one way to know how everything is working is to measure network, water flows, pressures, temperatures etc. using different measurement devices and services.
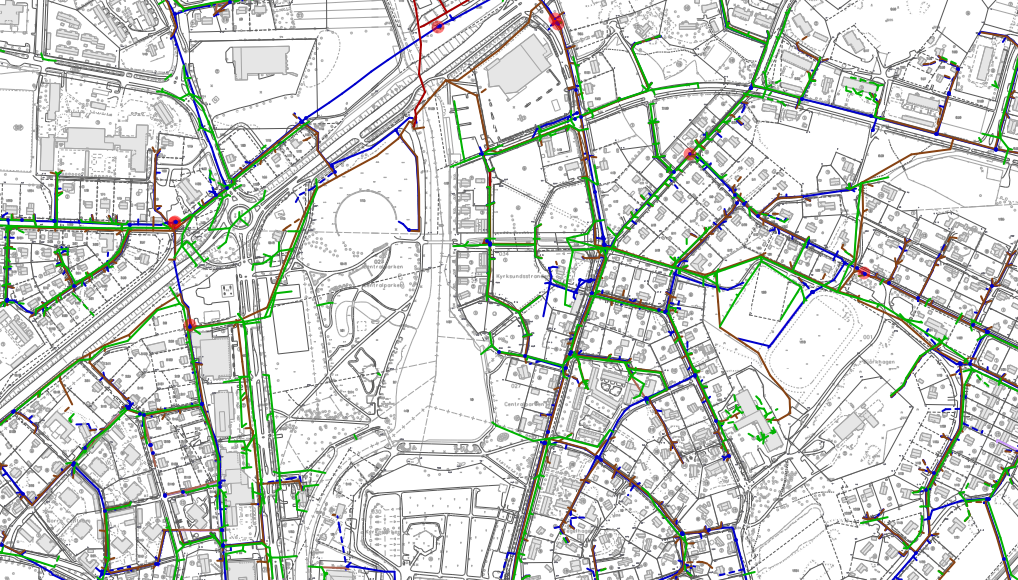 Picture: Closer view of the network and customer own detailed base map
Nowadays each market has their own local, country specific service providers and measurement device manufacturers, and many times different solutions also have different data models. There is no globally unified or standardized way how to create and manage data which is flowing between different software solutions and metering devices through integrations. Interfacing these different solutions to automate data transfer between the systems is possible but to connect different services as easy as possible, it requires productized and flexible solutions. This productized measurement database is something that KeyAqua GIS (Geographic Information System) already has, and it will be even better in the future due to growing needs to integrate. Currently KeyAqua already includes compatibility with several different measurement devices and new services are relatively easy to add.
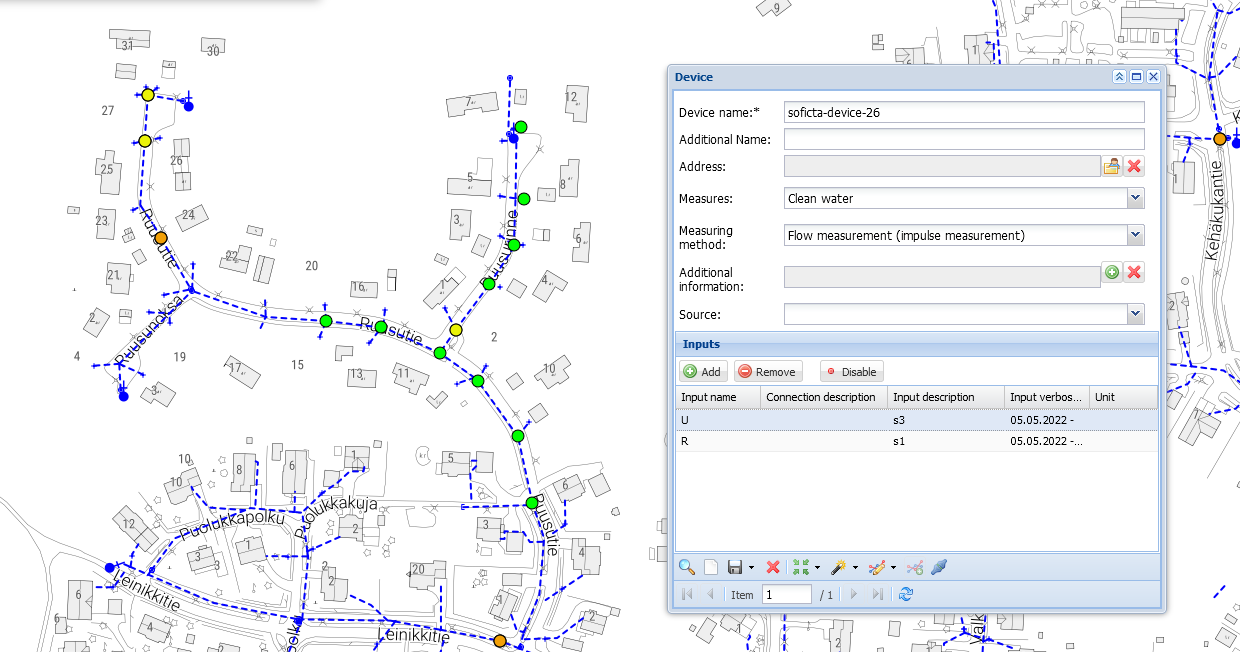 Picture: Water supply ducts and network status measured by IoT-device
KeyAqua GIS (and KeyHeat GIS) can be interfaced with different measurement services to show metering data visually together with network map in an easy-to-understand way. It is possible to define range of numerical values of metering devices and when this predefined range is exceeded, measurement device color changes on KeyAqua GIS map view from green to red. This indicates active problem, and something needs to be done. This way all users and water utility personnel can immediately see locations of all measurement devices and what is happening in the network and if any problems have occurred. It is also possible to import and show numerical metering data in KeyAqua GIS when needed. When deciding best possible solution, it is always about the use case that what end user is trying to achieve.
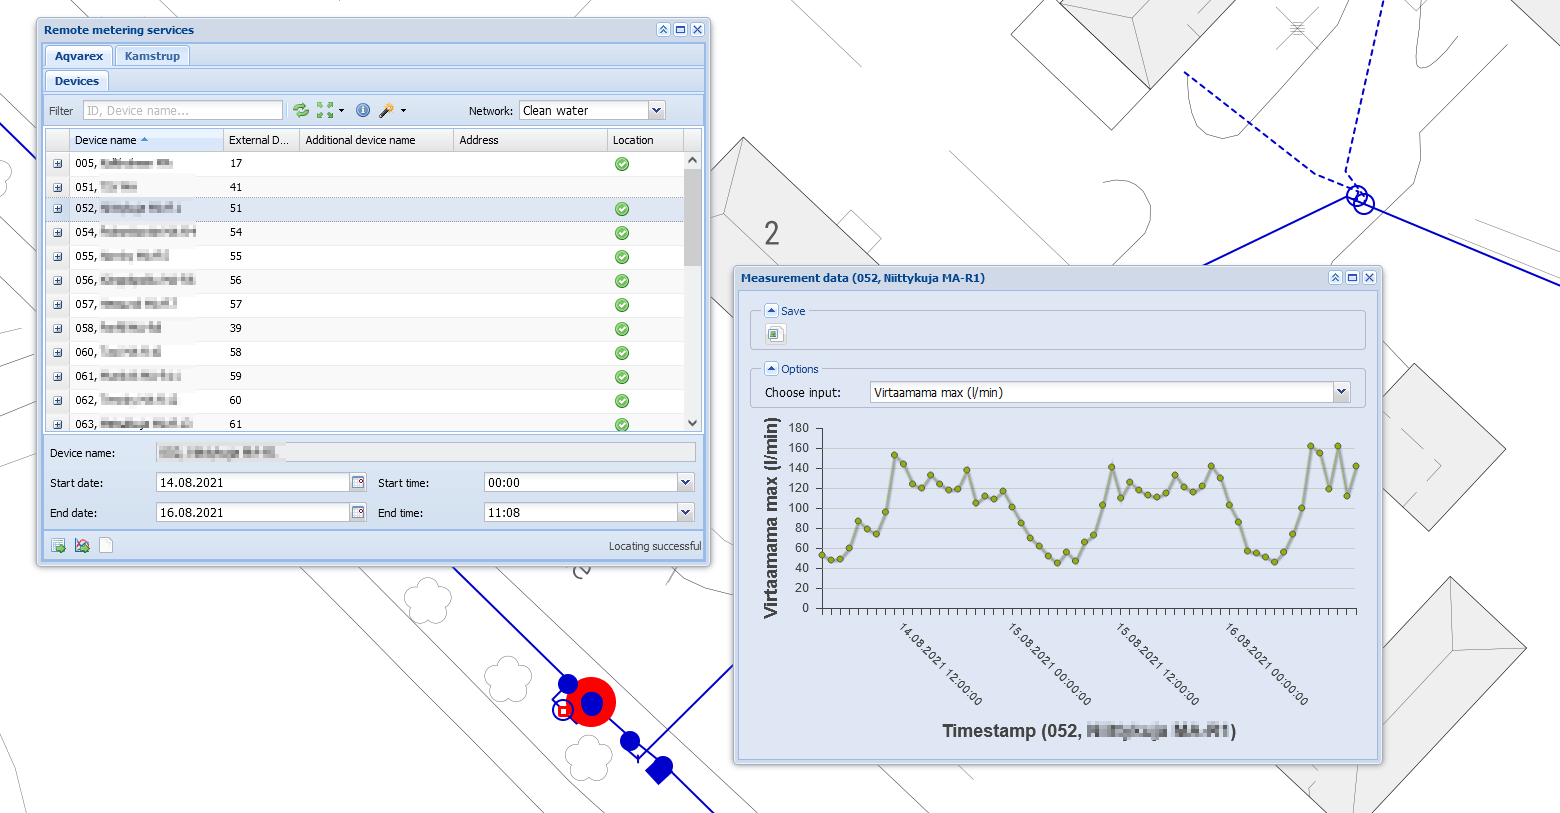 Picture: Measurement device location in network and measured data shown in graph format
Main idea when integrating with KeyAqua is not to replace metering device own software and analysis tool but to import and show all necessary information in one central view in KeyAqua such as utility network itself, customers, basemaps, cadastral information, metering device locations, possible alerts etc. This one central view of the network gives KeyAqua users possibility to understand network as a whole.
 By
By