
What is GIS?
Geographic Information System (GIS for short) is a computer system that analyzes, stores and displays geographic data. On one map GIS can show all kinds of data which makes understanding patterns and relationship easier for people.
Technically speaking, what does the measurement service do?
The measurement database service of the geographical and network information system retrieves the measurement results of different measurement data producers, i.e. device and software manufacturers, from the agreed source and stores them centrally in one place in a database optimized for this type of time series data. The service provides an interface for querying the measurement results, which can be used by different customers' KeyAqua and KeyDH GIS solutions. As a longer-term development, it is possible to perform various analyzes of the stored data using ready-made tools of the database.
What kind of information can be imported into the geographic information systems?
In principle, any time series data or alarms can be stored in the measurement database service. Currently, it is possible to import results from various data producers, eg Digita, Insta, Lining, HWM, Kamstrup, Mipro, Soficta. The results are most often water volumes, flows or water level heights, but also alarms that tell about the situation or condition of the network or the measuring device itself. It is possible to automatically visualize this information on the GIS map as alerts. This way, for example, site visits or maintenance tasks can be more quickly targeted at the right target.
What is the use of the measurement service for Keypro? How does it facilitate information management?
Previously, the measurement data in question was distributed in the own database of each customer using the geographic information system, so that the results of different data producers were located in their own table. This made it difficult to maintain information and develop the system. Any technical changes always had to be made in several places. Time series databases support fast export and search of measurement results and offer ready-made tools for time series analysis.
What is the use of the measurement service for the network owner? Why does the customer benefit from our measurement service?
For customers, i.e. mostly network owners, the benefit can be seen most in shorter information retrieval times when the information is viewed using the forms of the spatial information system. In addition, based on the collected data, it is possible to perform different analyzes more easily.
What can be done with the information?
Measurement results can be displayed by measuring device in the geographic information system directly as raw readings using the form intended for that purpose. With this form, you can choose the time period in which you want to view the readings, and after the search, the readings will either be listed in a table or they can also be displayed in a line diagram.
From these raw readings, e.g. area-specific flow sums for water balance calculation. That is, when it is known the amounts of water and waste water entering the area and being pumped out of the area, as well as an estimate of the amount of water consumed in the areas during that time, a leakage analysis can be made.
In addition, alarm data can be viewed as map visualizations. This way you can see at a quick glance where you should go to visit the site or where you should target maintenance.
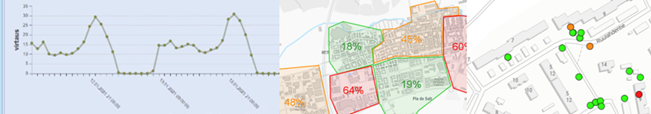
Image: The measurement service converts the data into an analyzed and visualized form. The information can then be viewed, for example, as a time series view or point/area visualization.
 By
By