
All network components have limited lifetime and they need to be replaced at some point. Also, problems and faults keep appearing all the time due to road accidents and faulty components. In addition to that, the network becomes more and more complex due to different IoT technology and lighting control system implemented to streetlight network. There can also be many different other kind of components such as measurement devices, cameras etc. that are attached to streetlight poles and related electricity network.
So how do you make sure that efficient daily operations can be implemented, all correct streetlight network components like lights, poles, cables, premises, fuses and other accessories are bought and installed in right time? Here high-quality network documentation plays a big role when planning these daily operations, future investments and other maintenance tasks of the network. Of course, everything starts from gathering network information directly using field survey and our blog post regarding to field data collection addresses this topic. Here you can read more how to collect information from the field using KeyLight KeyMobile field solution for tablets and smartphones.
Let’s jump to the situation that high quality streetlight documentation is already documented to KeyLight GIS (Geographic Information System). So, what we can do with that and how it can help us? In this case we could divide reporting to two different parts: first is what you can do with KeyLight's own reporting features and second is what you can do when connecting KeyLight to separate third party reporting and data visualization tool where several public and private data sources are connected. In this case data is also manipulated and enhanced significantly to create customized value added reports.
Before we jump to create reports, it is important to define metrics that needs to be followed to make whole network management more efficient. For example, we can simply analyze streetlight network component installation years to understand lifecycle when each component of the network need to be replaced. This is also an excellent way to understand how much resources like time and money are needed each year in future for component replacement tasks. The goal here is to keep number of light faults minimum, maintain high quality lighting and prevent streetlight network technical debt from increasing.
KeyLight reporting tools
KeyLight includes data visualization tools for users to see and understand easily current situation and condition of the network. Detailed network data can also be exported to Excel format for further processing if needed. Below few examples how visualization and reporting features can be used.
Investment needs
User can create customized visualizations on map view based on defined metrics. One good way to understand network condition and future investment needs is to create visualization for all components which are at the end of their lifetime and needs to be replaced soon.
It is possible to make 5-10-year investment and maintenance plan using this feature. Each year has its own specific colour assigned and components to be replaced at this year are highlighted. This way network owner can see future maintenance actions and it gives time to arrange necessary resources for tasks. In this case component installation years and expected lifetime of component is used to create visualization. This method can be applied all components like light units, poles, cables, premises etc.
For example:
Red: replace 2025
Yellow: replace 2026
Green: replace 2027
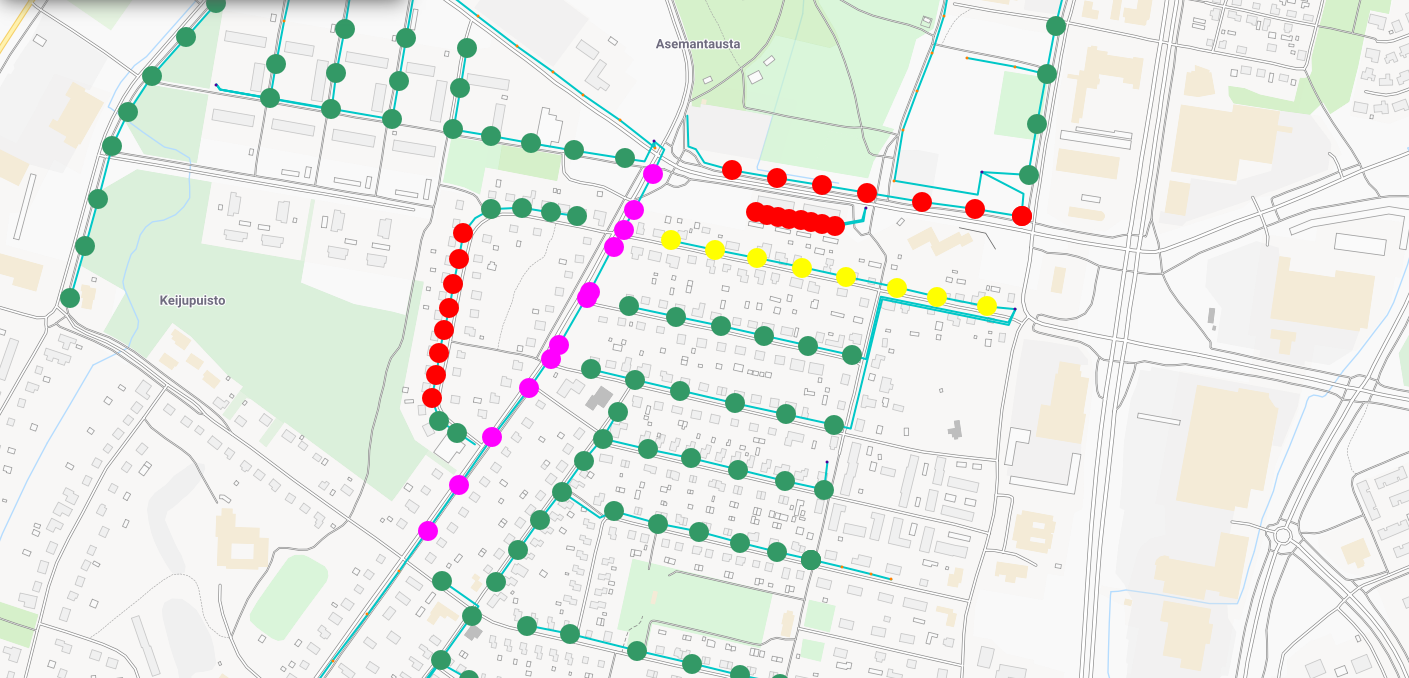
If detailed information of the network components are needed like length of the cables, total power of light units, number of poles, coordinates etc, user can export information to Excel file for further processing. Map visualizations helps everyone to understand big picture fast and information exported to Excel makes detailed cost planning possible.
More efficient daily operations
When making daily network operations on the field, it is important to remove all work which is not efficient nor productive such as making unnecessary field trips to check current situation, spending time trying to locate correct streetlight premise, figure out detailed light unit model and light distribution and of course to have all correct tools, trucks and right components when going to field. With good quality network documentation field workers can prepare tasks and plan daily activities so that operations are as efficient as they can be.
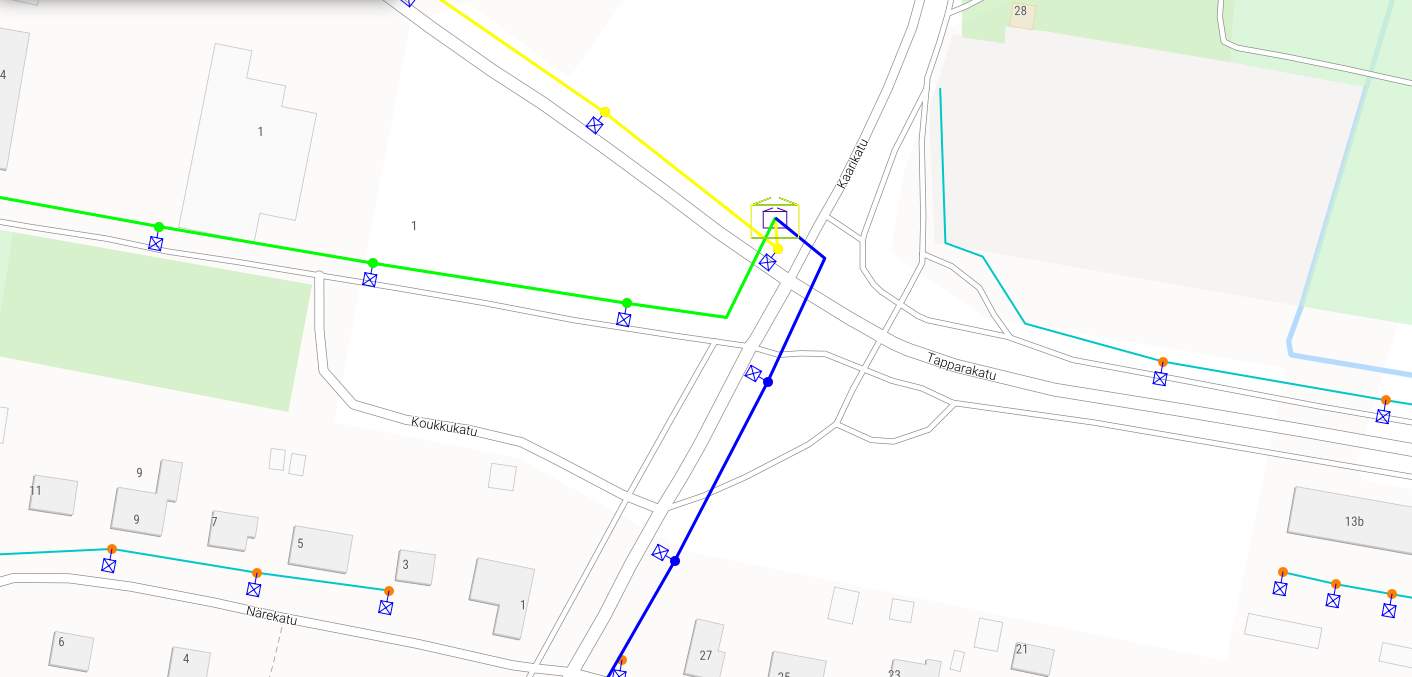
Using KeyLight field workers can locate broken streetlight, then follow the network connections starting from selected light unit to connected streetlight premise via cables and highlight route. No need to go out to the field and spend time locating premises and testing which premise and which output will cut off power in right place to make necessary field tasks like light unit replacement.
Third party reporting tools
KeyLight can be connected to specialized third-party reporting tools using interfaces. This enables possibility to combine many different public and private data sources, manipulate and enhance data and create customized dynamic reports for very specific needs.
With reporting and data manipulation tools it is possible for example to create formulas to calculate cost efficiency and payback time when certain types of older light units are replaced with new technology. This improves significantly investment planning accuracy and makes possible to compare different investment scenarios in easy way. Data can also be shared with stakeholders like contractors and planners and ask them to investigate and propose actions to improve network operations.
When combining different data sources like information about road accidents, IT-systems can create even more possibilities to improve not only network operations but also safety of the citizens. Network owner can compare those areas where lights are turned off during night time and where road accidents are happening frequently. This gives possibility to optimize and rethink those areas where lights should or should not be turned off.
With bigger networks with lot of stakeholders, quality of network documentation might get easily fragmented due to different ways of documenting network. These specific reporting tools can be assigned to report quality of documentation using specific metrics. For example, if documentation instructions requires to collect and insert certain network object attributes to KeyLight, reporting tool can alert network owner when this requirement is not fulfilled. This way network owner can automate quality control of network documentation.
Possibilities are endless when combining data sources to create value added reports to make life better and easier. Only challenge is to understand huge amount of data and what are goals for network operations now and in a future.
 By
By